Page updated:
October 11, 2021
Author: Curtis Mobley
View PDF
Bioluminescence
Sunlight is obviously the main source of light in the upper ocean, but there is no sunlight at night or below the 1000 meter limit of the “twilight zone.” However, fish that live in even the deepest parts of the ocean have eyes, and often very sophisticated ones. This suggests that there must be as least some light in the deepest parts of the ocean, even if the light is too faint to be seen by human eyes. And indeed there is. This light comes from two sources: light emitted by living organisms and visible radiation emitted by the decay of naturally occurring potassium.
This page discusses bioluminescence, which refers to the ability of an organism to generate light by chemical reactions. The next page discusses Cherenkov radiation, the light emitted by radioactive decay.
Deep in terrestrial caves, where sunlight never reaches, there are species of animals that have completely lost their sight, even to the point of having no eyes at all. These include fish, salamanders, arthropods, and crustaceans. [A few examples from around the world are as follows. Fish: the Mexican Blind Cave Fish, Astyanax mexicanus. Salamanders: the Slovenian olm, Proteus anguinus; and the Texas Blind Salamander, Eurycea rathbuni. Arthropods: the Kauai Cave Wolf Spider, Adelocosa anopsthe; the Narrow-necked Blind Cave Beetle, Leptodirus hochenwartii, also found in Slovenia; and Trechinae beetles of the genus Dongodytes in China. Crustaceans: the Blind Albino Cave Crab, Munidopsis polymorpha, of the Canary Islands; and the venomous, centipede-like remipedes of the globally distributed Class Remipedia.] Eyes are energetically expensive to grow and image processing can require a considerable part of an animal’s brain, so it is not surprising that animals that live in lightless environments have lost their eyes over countless generations and have evolved to use other senses.
On the other hand, light-emitting marine organisms are ubiquitous in the world’s oceans. They range in size from bacteria to fish, and they are found from the sea surface to its bottom and from polar waters to the equator. The many possible ecological roles for self-emitted light include communication for courtship or schooling, attraction of prey, escape from predators, and camouflage by counterillumination. (See https://biolum.eemb.ucsb.edu/functions.html and Haddock et al. (2010) for a discussion of the possible roles of bioluminescence in the ocean.)
Bioluminescence also occurs in terrestrial organisms from fungi to fireflies, but is known to occur in only one freshwater species (Latia neritoides, a mollusk found only on the North Island of New Zealand). There does not appear to be any species that spends its entire life in terrestrial caves that bioluminesces. The famous “glowworms” found in some caves are the larval stage of several types of fungus gnats, which leave the caves as adults. It thus seems that the true cave dwellers have gone the route of having no eyes at all, whereas the denizens of the deep ocean have evolved to generate their own light. It is estimated that 75% of all marine organisms can generate light. Several reviews, Widder (2010), Haddock et al. (2010), Widder (2002), have surveyed the biological, chemical, and ecological aspects of marine bioluminescence. Widder (2006) gives a short history of research on bioluminescence.
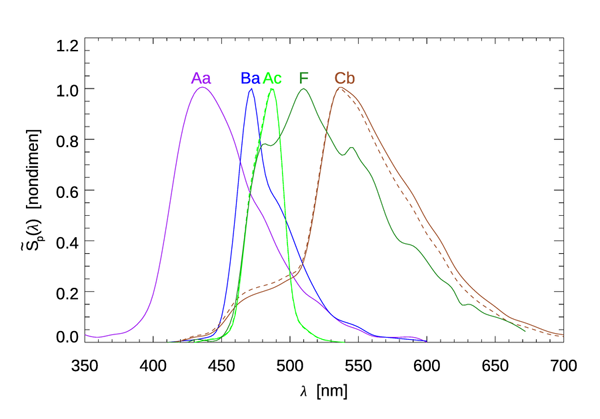
Widder et al. (1983) examined the shapes of of the emission spectra for 70 marine species ranging from bacteria to fish. Figure 1 illustrates the range of shapes of encountered in their study. Their instrument counted photons detected by a linear CCD array for 1024 wavelength bins. These spectra thus describe the distribution of numbers of photons emitted. For each photon spectrum there is an associated energy spectrum as discussed below. The wavelengths of maximum emission, , and the full-width at half-maximum of the emission band, , are indicated in the figure caption. The range of was 439 nm to 574 nm, with an average over all species of 483 nm. The bandwidths ranged from 26 nm to 100 nm, with an average of about 75 nm. Not surprisingly, these wavelength bands usually coincide with the wavelengths where sea water is most transparent.
The magnitude of emission shows more variability than its spectral shape. We first note that most bioluminescent organisms emit light only when they are disturbed. The most common light-inducing disturbance is mechanical stimulation, as when an organism is entrained into a ship’s turbulent wake or feels a pressure wave caused, perhaps, by an approaching fish. Flashing lights, electrical fields, earthquakes, and chemical irritants have been known to induce bioluminescence. Lapota et al. (1986) give an interesting description of bioluminescence induced by an ordinary flashlight. When disturbed, organisms emit a flash of light that may last from tens of milliseconds to several seconds. The exception to this statement is certain bacteria, which are able to emit light continuously.
A common measure of the strength of bioluminescence is is the number of photons emitted per second by a disturbed organism. Typical values are for bacteria, and to for dinoflagellates; Bachelder and Swift (1989) give an average value of for the dinoflagellate Pyrocistis noctiluca. See Lynch (1978) for a tabulation of emission strength for 58 marine species.
A quick calculation gives a feeling for the light levels that are possible. For the dinoflagellate spectrum Ba of Fig. 1, the average wavelength is
| (1) |
Assuming a typical concentration of for a bioluminescent dinoflagellate, with each cell emitting , with an average wavelength of 487 nm, and converting the photon count to energy units via Eq. (1.1), gives
If this power is generated in a sphere of volume (for example, in a turbulent eddy), then the surface of the sphere receives an irradiance of order . Reference to Table 1.6 shows this broad-band irradiance to be greater than that of a clear, starry night, but much less than that of a bright, moonlit night.
Modeling Bioluminescence in Radiative Transfer Calculations
Although disturbed organisms can provide enchanting light shows, some of the most spectacular displays are caused by bacteria near the sea surface. The large numbers of bacteria and their ability to emit light continuously more than make up for their low photon emittance per cell. The Indian Ocean and Arabian Sea are known for their horizon-to-horizon displays of luminous “milky seas,” which can generate enough light for reading on the deck of an otherwise dark ship. Mariners’ logs contain many such reports; see Kelly and Tett (1978) for examples. Lapota et al. (1988) give quantitative observations of a milky sea event. Milky seas can cover as much as and have even been detected from space (Miller et al. (2005), Miller et al. (2021)).
Horizontally uniform milky seas are a one-dimensional geometry, so they can be simulated using HydroLight. A simulation is worthwhile as an example of constructing an internal source term for the radiative transfer equation.
Bioluminescence is included in the scalar radiative transfer equation (3) of the Scalar Radiative Transfer Equation page via a source term , which has units of . This function gives the strength of the bioluminescence as a function of depth, direction, and wavelength. Small organisms such as bacteria or dinoflagellates can be assumed to emit light isotropically, in which case can be written as
| (2) |
where gives the emitted spectral power in units of .
As noted above, the spectra of Fig. 1 are for the number of photons emitted, denoted by (subscript “p” for photon). By Eq. (1.1), the energy of a photon of wavelength is . Thus the corresponding energy spectrum is given by
| (3) |
We can write as the product of a maximum value and a normalized spectral shape:
Lapota et al. (1988) measured values of 1– during periods of high bioluminescence in the Arabian Sea. Let us take the high value to set the magnitude and use the spectral shape of curve Cb in Fig. 1 for . The integral of this is
Dividing by 98 nm sets the magnitude:
The resulting then integrates to give back as required to describe the number of photons emitted over all wavelengths.
The corresponding energy spectrum as computed by Eq. (3) is plotted in Fig. 2. The dashed curve in Fig. 1 shows the shape of this compared to the shape of the photon spectrum . Because photons with shorter wavelengths carry more energy than those with longer wavelengths, the energy spectrum is shifted towards the blue. In the present case, the normalized photon and energy spectral shapes differ by as much as 31% (near 700 nm).
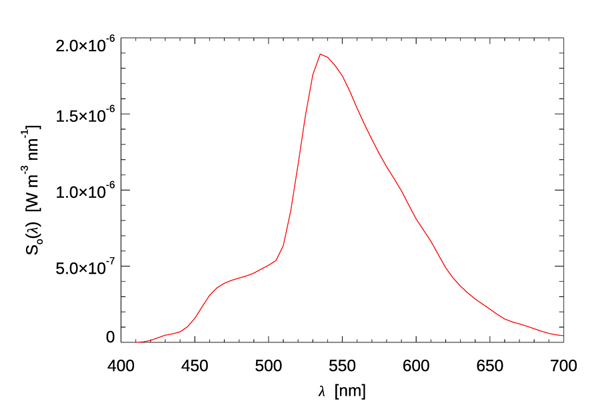
This energy spectrum is now used in Eq. (2) to define the source function. For the present simulation, it is assumed that the water column is homogeneous1 . The satellite observations in Miller et al. (2021) are in waters with chlorophyll concentrations of 0.5 to , so a value of was used in HydroLight’s “new Case 1” IOP model. The sky was totally black, so the only light source was the bioluminescence. The resulting HydroLight simulation gives an in-air illuminance of . Table 2 of the Luminosity Functions page shows this to be almost as large as the illuminance of a full moon in a clear sky. Thus, just as the mariners claim, you can indeed read by the light of a milky sea.
 See comments posted for this page and leave your own.