Page updated:
March 13, 2021
Author: Collin Roesler
View PDF
Benchtop Spectrophotometry of Particulates on Filters
Benchtop Spectrophotometry of Particulate Matter Collected on Glass Fiber Filters (the Quantitative Filter Technique) Measured Internally-mounted in the Integrating Sphere (the QFT in IS-mode)
The size and shape of commercially available integrating spheres limits the geometric pathlength of cuvettes that can be internally mounted. Thus to obtain a strong signal to noise, the concentration of suspended matter in a 1-cm cuvette has to be much higher than is generally observed in aquatic systems. For this reason, discrete water samples are filtered onto glass fiber filters (Whatman GF/F) and the absorbance of the filters is measured. The protocol is identical to that outlined previously with the exception that the baseline/blank scans are performed with a blank filter through which a comparable volume of pure water has been filtered (to flatten the fibers in a comparable manner to that of the sample filter). The filter is placed in the sample holder (same location as the cuvette), perpendicular to the sample beam with the top of the filter (particle side) facing the incoming sample beam. Thus the sample beam interacts with the particles prior to interacting with the filter. The computation of absorption is
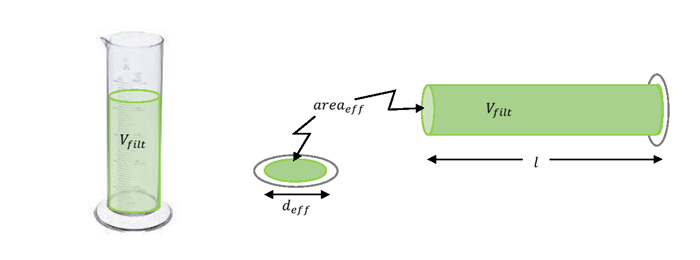
where the geometric pathlength is computed from the measured sample volume filtered (ml), and the effective area of the filter (). The geometric pathlength can be thought of as a cylinder of water of cross section equal to the effective filter area and length, , sufficient to account for the volume filtered (Fig. 1). The geometric pathlength of the sample on the filter is equivalent to the length of the cylinder of the original suspension.
Comparisons between samples measured in cuvettes with those measured on filter pads indicates that there is an amplification of the mean photon path through the filter in the original sample beam over that of the geometric path. This is called pathlength amplification. It arises as light rays scatter within the filter and particles before exiting into the sphere. It is not accounted for by the reference beam. Careful and extensive paired measurements have demonstrated that the amplification is not negligible (Fig. 2).
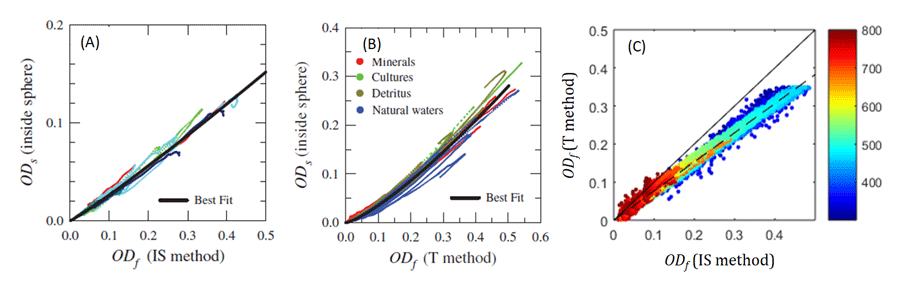
The pathlength amplification must be corrected before the computation of absorption. The correction, derived empirically from the data in Fig. 2A, is
where is the absorbance (optical density) measured in suspension and is the absorbance (optical density) measured on the filter pad. The absorption coefficient is computed from the absorbance measured on the filter pad:
Historically, the QFT was employed measuring the filters in transmission mode (as in Figure 1 on the Benchtop Spectrophotometry of Solutions page, with the cuvette replaced by the filter). In addition to the pathlength amplification within the filter, there was an additional error associated with the loss of nearly half the incident radiant power scattering in the backward direction (away from the detector). The correction for both the scattering loss and pathlength amplification are determined from paired suspension measurements in internally-mounted cuvettes in the integrating sphere and filtered particles on filtered configured in transmission mode, (Fig. 2B):
A simple linear relationship has been found relating the absorption measured on filters in transmission mode, , to that measured in the integrating sphere, :
The linearity is only found for absorbance values less than 0.35 in the transmission mode, and 0.45 in integrating sphere mode (Fig. 2C). Beyond that range, the relationship becomes non-linear.
While measuring the absorption by particles on the filter pad comes with measurement challenges and increased uncertainty, it does allow absorption to be determined on optically dilute samples. In addition, the particulate matter can be extracted with methanol (Kishino et al. (1985)) to remove the extractable phytoplankton pigments from the particulate matter. The scan of the extracted filter yields the absorbance by the non-algal particle fraction. After computing the absorption spectra for the particulate scan and the non-algal particle scan, the absorption by in vivo phytoplankton pigments (as they were, bound to proteins in the light harvesting complexes in the chloroplasts) can be computed by difference.
 See comments posted for this page and leave your own.