Page updated:
March 13, 2021
Author: Collin Roesler
View PDF
Absorption by Oceanic Constituents
This page introduces the absorption coefficients of the most important oceanic constituents that determine the total optical absorption in the ocean, namely
- Water
- Phytoplankton
- Non-algal Particles
- Colored Dissolved Organic Matter
- Colored Dissolved Inorganic Matter
In each case we can define a typical spectrum and the typical range of spectral variations that are typically encountered.
Water
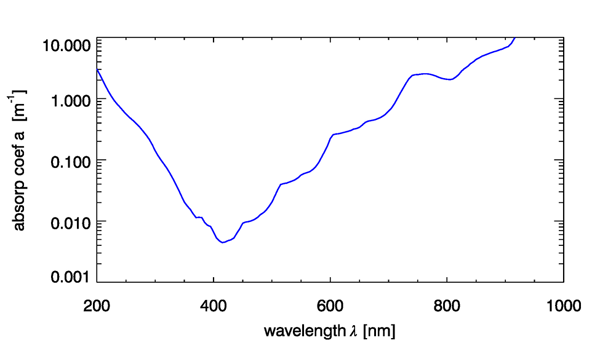
The absorption by pure water in the visible region of the spectrum is low in the blue and increases into the UV, red and infrared with visible harmonics associated with state transitions (Fig. 1). There are large variations in the measurement of pure water absorption coefficients, with the largest variations in the blue region of the spectrum, likely due to contamination by organic matter.
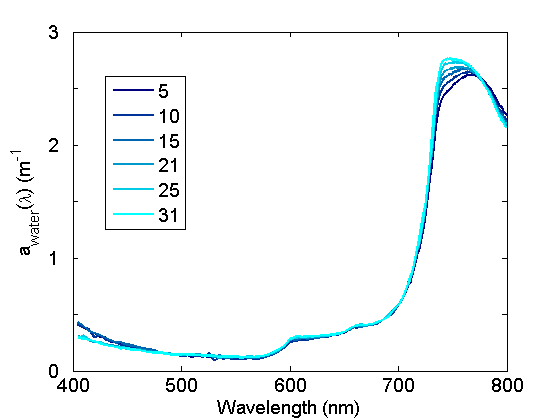
The absorption coefficients in the near IR spectral regions associated with harmonic features exhibit significant variations with water temperature (Fig. 2) and to a lesser degree, salinity. These variations are important to quantify and account for when (1) modeling total in situ absorption, (2) applying calibration coefficients to ac meters, (3) measuring absorption spectra spectrophotometrically in cuvettes relative to a pure water blank.
Additional information on absorption by water is given on the Optical Constituents/Water page.
Phytoplankton
Phytoplankton absorption is determined by the composition and concentration of pigments (Table 1).
Pigment composition of the major algal groups, relative concentrations indicated by
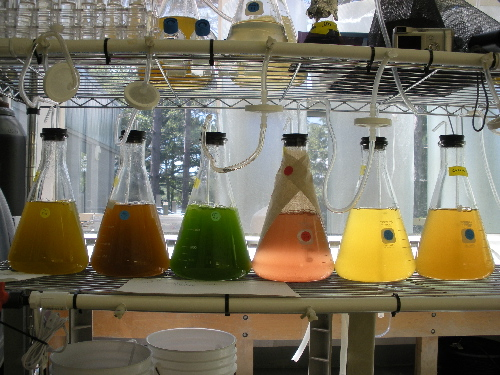
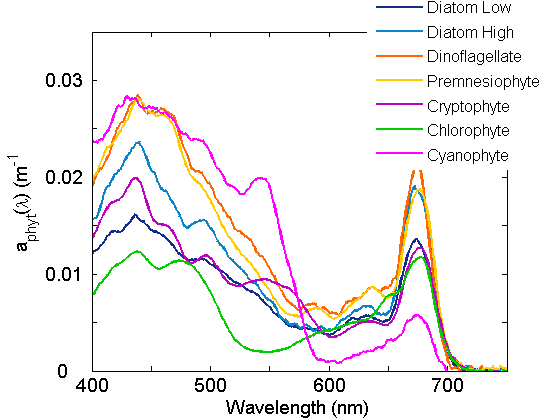
Pigments have unique absorption spectra which lend a range of colors to phytoplankton (Fig. 3) and a range of spectral shapes to the respective absorption coefficients (Figure 4). The major groups of pigments are the chlorophylls, the carotenoids and the phycobilipigments.
Chlorophylls, which are structurally a tetrapyrole ring and carbon chain tail, typically have two absorption peaks, one in the blue and one in the red (Figure 2A). Carotenoids are structurally long double-bonded carbon chains with broad single peaked absorption spectra in the blue-green wavelength range (Figure 2B). Phycobilipigments are structurally in between with chains of pyrole rings and have broad absorption peaks in the yellow to orange wavelength range (Figure 2C).
fig. Example chemical structures (upper) and associated absorption spectra (lower) for pigments in extract A. Chlorophylls (a), B. Carotenoids (beta carotene), C. Phycobilipigments (phycoerithrobilin).
Given that each pigment has a unique spectrum and each species of phytoplankton has a characteristic pigment complement, the absorption for that species can be reconstructed from the sum of the individual pigment absorption spectra (Figure 2). Variations within the species are observed as pigment ratios vary. Acclimation to varying growth irradiance is primarily responsible for variation in cellular pigment concentration and pigment ratios, with higher cellular pigment concentration and varying accessory pigment to chl a ratios observed for cells acclimated to low light (Figure 3).
Fig A. Variations in cellular pigment concentrations as a function of growth irradiance for a dinoflagellate. B. Variations in carotenoid to chl a ratios as a function of growth irradiance for three phytoplankton species. From Sosik and Olson 1989.
Thus the observed in situ phytoplankton coefficient is dependent upon the absolute concentration of cells, the composition of the phytoplankton community and the variations in pigment composition within each species. Adding each individual spectrum yields the total phytoplankton spectrum (links to Figure 2 of Introduction page).
Non-Algal Particles, NAP
The non-algal particle component, NAP, is defined operationally as the particulate material that is not extracted by methanol (Kishino et al. 1985) in the spectrophotometric measurement of particles on filter pads. Thus it is a composite of living organic particles such as bacteria, other protists, zooplankon, detrital organic matter, and suspended inorganic particles (lithogenics). Although widely variable in composition, the absorption spectrum is relatively invariant, highest in the blue-uv portion of the spectrum, decaying approximately exponentially to the red (Figure 1).
Constituents of the NAP absorption. A. Individual detrital particles from the Sargasso Sea measured microphotometrically (Iturriaga and Siegel, 1989); B. Detrital absorption generated by the photo-oxidation of algal matter (Nelson and Robertson 1993). C. Ciliate, Flagellate and D. Bacterial absorption spectra (Morel and Ahn 1990). E. Mineral particles (Babin and Stramski 2003). F. Saharan aerosols (Patterson et al. 1977).
Often an exponential function is fit to the absorption spectrum and the slope is estimated by non-linear regression:
| (1) |
Where is the exponential slope for NAP. Variations in the slope are observed to be from 0.006 to (Figure 1; Roesler et al. 1989; Babin et al. 2003), statistically flatter than the slopes observed for CDOM.
A. Probability distribution of spectral slopes for NAP absorption from the European coastal waters and B. resulting variations in the absorption spectra (Babin et al. 2003).
The contribution to NAP by non-organic particles is particularly important near rivers and in benthic boundary layers. Absorption spectra measured by lithogenic samples indicate a similar absorption spectral shape with some features in the visible, particularly associated with high iron content (Figure XE; Babin and Stramski 2001).
Colored Dissolved Organic Matter, CDOM
CDOM is defined operationally as the material that passes through a filter of nominal pore size 0.2 mm (Bricaud et al. 1981) or 0.7 mm if spectrophotometric closure is to be achieved (Simeon et al. 2003). This fraction includes organic substances as well as inorganic salts, both of which exhibit absorption peaks in the ultraviolet portion of the spectrum (Figure). The visible portion of the spectrum is dominated by the organic fraction and thus the term CDOM is used. The absorption in the visible decays approximately exponentially to the red (Figure), and an exponential function is fit to the absorption spectrum and the slope is estimated by non-linear regression:
| (2) |
Where is the exponential slope for CDOM. Variations in the slope are observed to be from 0.012 to (Figure 1; Roesler et al. 1989; Babin et al. 2003), statistically steeper than the slopes for NAP.
A. Probability distribution of spectral slopes for CDOM absorption from the European coastal waters and B. resulting variations in the absorption spectra (Babin et al. 2003).
The spectral slope has been shown to be an indicator of organic matter composition (Figure 2; Carder et al. 1989)with fulvic terrestrial material having steeper spectral slopes than marine-derived humic material.
Variations in spectral slope for humic marine waters and fulvic river waters in the Gulf of Mexico (Carder et al. 1989). Observed slopes vary from approximately 0.01 to , respectively.
Variations in spectral slope have also been associated with size fractions of CDOM (i.e. and to ) and qualitatively an indicator of refractory vs labile organic matter (Figure 3; Simeon et al. 2001).
Distribution of CDOM absorption coefficients at 440nm along the equator in the Pacific for two size fractions, mm found in deep upwelling waters and 0.2 mm to 0.7 mm colloidal fraction found in the surface waters associated with phytoplankton blooms. The spectral slope of the two fractions was 0.02 nm-1 for the old refractory material and 0.011 nm-1 for the new labile material, respectively. From Simeon et al. 2003.
 See comments posted for this page and leave your own.