Page updated:
October 13, 2021
Author: Ivona Cetinic
View PDF
Phytoplankton
Phytoplankton have a major effect on the ocean color and are one of the primary reason for studying it. Additionally, these microscopic, single cell, free -floating organisms posses chlorophyll, pigment that allows them to harvest the sunlight and through the process of photosynthesis produce energy rich organic material, while releasing the oxygen. That makes them the most important primary producers in the ocean, base of the oceanic food web and important component of the global carbon cycle (Falkowski and Raven ( 2007)). For all these reasons it is of a great importance to understand phytoplankton abundance and dynamics.
Phytoplankton are taxonomically diverse group—it comprises more than 10,000 species and taxa (Jeffrey and Vesk (1997)). Number wise, the most important groups of phytoplankton include diatoms, dinoflagellates, coccolithophorids, although many other types of algae are part of phytoplankton. Additionally, an important group from the realm of bacteria, cyanobacteria, is part of the phytoplankton. They come in different sizes (from to ), shapes (spheroids, cylinders, prolate spheroids and many more), builds (cellulose, silicate or calcium-carbonate cell walls) and with many different physiologies. Phytoplankton contains large number of different pigments, most important of them - chlorophyll. Depending on group or taxa, varying concentrations of other pigments will be present in the cell - other chlorophylls, carotenoids, billiproteins (Jeffrey et al. (1997)). All specifics of phytoplankton make up mentioned above will impact the phytoplankton optical properties, and allow us to study their ecology and evolution in time by measuring them. Chlorophyll fluorescence is discussed in more detail on the Chlorophyll Fluorescence page.
Absorption by Phytoplankton
Phytoplankton absorb sun light and use this energy to produce energy rich organic material (photosynthesis). Chlorophylls, present in all phytoplankton cells, will cause 2 dominant peaks in absorption spectra, primary at blue ( 440 nm) and secondary peak in red part of the spectra ( 675 nm). Presence of other pigments (depending on species and taxa) will cause the broadening of blue peak and appearance of additional absorption maxima. These taxa specific absorption peaks have been used as an optical detection tool in situ (Kirkpatrick et al. (2000)) as well for development of remote sensing algorithms (Subramaniam et al. (2002); Tomlinson et al. (2009)).
But, absorption by phytoplankton is not a simple sum of absorption coefficients of individual pigments. Spectra of phytoplankton absorption, , varies in magnitude and shape due to the different cellular pigment composition and pigment packaging (Bidigare et al. (1990); Bricaud and Stramski (1990); Hoepffner and Sathyendranath (1991); Ciotti et al. (2002)); Bricaud et al. (2004)). Specific pigment-protein complexes present in the cell will cause changes in absorption spectra and magnitudes . Furthermore, the increase in cellular pigment concentration and cell size, i.e. packaging effect, will flatten the specific absorption spectra Duysens (1956); Kirk (1976); Morel and Bricaud (1981); Johnsen et al. (1994)).
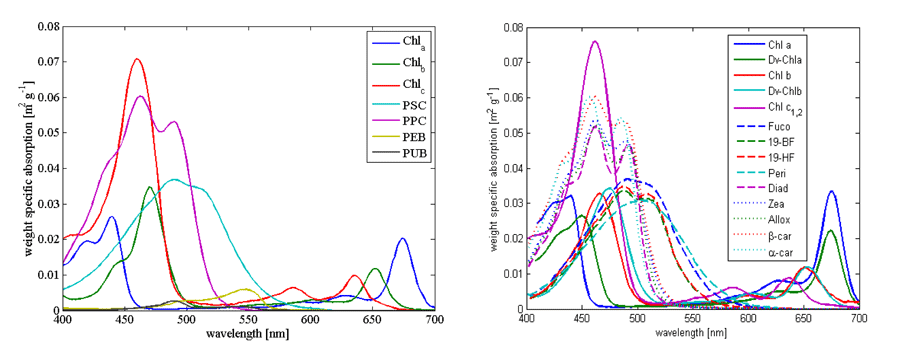
For theoretical calculations of phytoplankton absorption and inversion of measured absorption spectra we need measurements of in vivo spectra. Here we display (Fig. 1) and link two such databases that are based on absorption in solvent with absorption spectrum shifted to match those observed in-vivo. One is from Bidigare et al. (1990) (here), and the other from Bricaud et al. (2004) (here).
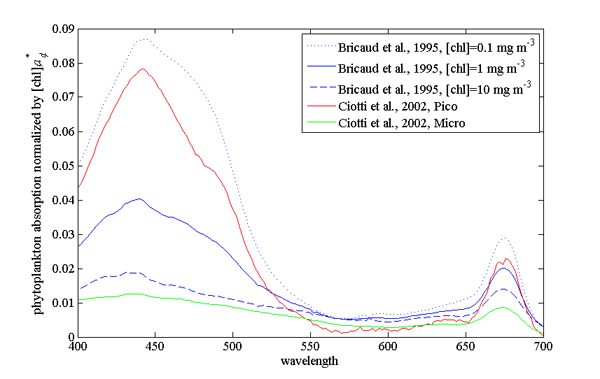
Example of absorption spectra of phytoplankton normalized by chlorophyll were provided by Bricaud et al. (1995); Ciotti et al. (2002) and showcase variability in pigments, packaging (flattening of the peak where absorption is high) and differences between large and small cells (Fig. 2, their data is (here).
Scattering by Phytoplankton
Scattering properties of phytoplankton are important since they are directly related to remote sensing reflectance calculations (via backscattering to absorption ratio). Scattering and backscattering coefficients of phytoplankton as well as the volume scattering function are derived from either theoretical models (Mie theory) or direct measurements of above mentioned properties (Bricaud et al. (1983); Volten et al. (1998); Witkowski et al. (1998); Vaillancourt et al. (2004); Sullivan and Twardowski (2009)). They highly depended on size, shape and refractive index of all components of the phytoplankton cell (Volten et al. (1998); Witkowski et al. (1998); Jonasz and Fournier (2007); Sullivan and Twardowski (2009)). Values of phytoplankton scattering coefficients, when compared to the rest of the oceanic particles, are relatively low, based on their high water content and strong absorptive properties (Aas (1996)). Exception to the rule are coccolithophores - phytoplankton that produces small calcium carbonate scales, that makes them very effective scatterers, and allow us to see coccolithophorid blooms from space (Balch et al. (1996)). Discriminating phytoplankton based on their angular scattering properties was suggested by Wyatt and Jackson (1989).
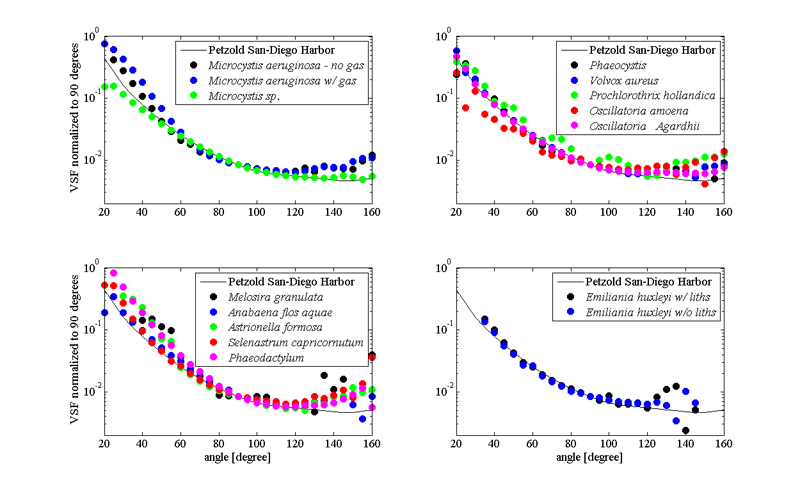
Our knowledge about the angular distribution of scattering for phytoplankton is scarce due to the small number of experimental datasets (Petzold (1972); Morel and Bricaud (1986); Volten et al. (1998); Witkowski et al. (1998); Vaillancourt et al. (2004); Lotsberg et al. (2007)). In general, phytoplankton cells forward scattering dominates over scattering in backward direction, consistent with their large size to wavelength ratio (Fig 3). Such angular distribution of scattering is causing low backscattering ratios observed for phytoplankton populations in situ (Twardowski et al. (2001)).
Following basic formula of inherent optical properties where scattering is the difference between attenuation of the light and absorption (), and mostly featureless attenuation spectra of phytoplankton, one can assume influence of the absorptive properties of the cell to the shape of the spectral scattering (Bricaud et al. (1983)); a photon absorbed is not scattered. The scattering spectra will, in general, be a inverse picture of absorption spectra of the same species. Similar patterns are observed in backscattering too (Stramski et al. (2001); Gordon et al. (2009)). More exactly, the phenomenon anomalous dispersion (van de Hulst, 1957; Bricaud et al. (1983)) explains the modulation of the scattering spectra near region of strong absorption bands.
Fluorescence by Phytoplankton
Portion of the light absorbed by phytoplankton cell can be emitted at another - longer wavelength; a process referred to as fluorescence. A recent comprehensive review of the subject is provided by Babin (2008). Several phytoplankton pigments (chlorophylls , pheopigments and phycobilins) fluoresce, with chlorophyll a fluorescence being the most significant one. Although fluorescence is only a form of energy dissipation of the absorbed light, secondary to photosynthesis, it is still significant enough to be observed from space (Neville and Gower (1977); Huot et al. (2005)).
Fluorescence from phytoplankton chlorophyll is often expressed expressed this simplified formula (Falkowski and Kiefer (1985)):
where is the intensity of light impinging on the cell, is chlorophyll concentration, is chlorophyll-specific phytoplankton absorption coefficient and is the quantum yield of fluorescence—the emission efficiency of the cell. Phytoplankton fluorescence and intensity depends (via quantum yield of fluorescence and chlorophyll-specific phytoplankton absorption coefficient) on several factors; taxonomic position of algae, pigment content and ratios, photoadaptation, physiological state of phytoplankton, nutrient conditions and stage of growth (Prezelin and Alberte (1978); Falkowski and Owens (1980); Babin (2008); Cullen, 2008). Measuring in-situ chlorophyll fluorescence is the most frequent method for describing chlorophyll and phytoplankton distribution in the ocean (Cullen, 2008), but above mentioned drivers of chlorophyll fluorescence variability makes interpretation of the chlorophyll fluorescence data anything but straightforward. Again, we refer the readers to Babin (2008), for a comprehensive treatment of this important topic. Fluorescence by phytoplankton is discussed in more detail on the Chlorophyll Fluorescence page.
 See comments posted for this page and leave your own.