Page updated:
January 5, 2021
Author: Emmanuel Boss
View PDF
Colored Dissolved Organic Matter
Colored or Chromophoric Dissolved Organic Matter (CDOM) is an important optical constituent in water, often dominating absorption in the blue. The quantification of the amount of CDOM present in the water is based on the absorption or fluorescence by material passing through a given filter (most often with pore size of ). As such, it is an absorption (or fluorescence)-weighted sum of the different dissolved materials in the water. Note that most of the material comprising dissolved organic matter (DOM) does not absorb or fluoresce and that there exist inorganic dissolved materials that also absorb (e.g. iron oxides, nitrate), though it is believed that fluorescence is due solely to organic materials. From this discussion it follows that CDOM is not necessarily a good proxy for DOM, particularly in the open ocean. Nevertheless CDOM has been found to be a useful tracer of water masses, as well as an indicator of different biogeochemical processes (see Coble (2007), for a recent review article on the link between the optical and chemical properties of DOM). Sample preparation and methodology of measurement are important in order to obtain accurate CDOM measurements. See Nelson and Coble (2009) for a recent analysis of methodology.
In the United States at least, colored dissolved organic matter is usually called CDOM. However, you will also see the terms “yellow matter,” “Gelbstoff” (German for “yellow matter”), or “gilvin.” The name gilvin, from a Latin word meaning pale yellow, was proposed by Kirk (1994) but does not seem to be widely used. Absorption by CDOM is commonly denoted by , , or sometimes .
CDOM Absorption
Figure 1 shows several measurements of CDOM absorption. For wavelengths greater than 300 nm, decreases roughly exponentially with increasing wavelength. Below 300 nm there is a change in slope and a rapid increase in CDOM absorption with decreasing wavelength.
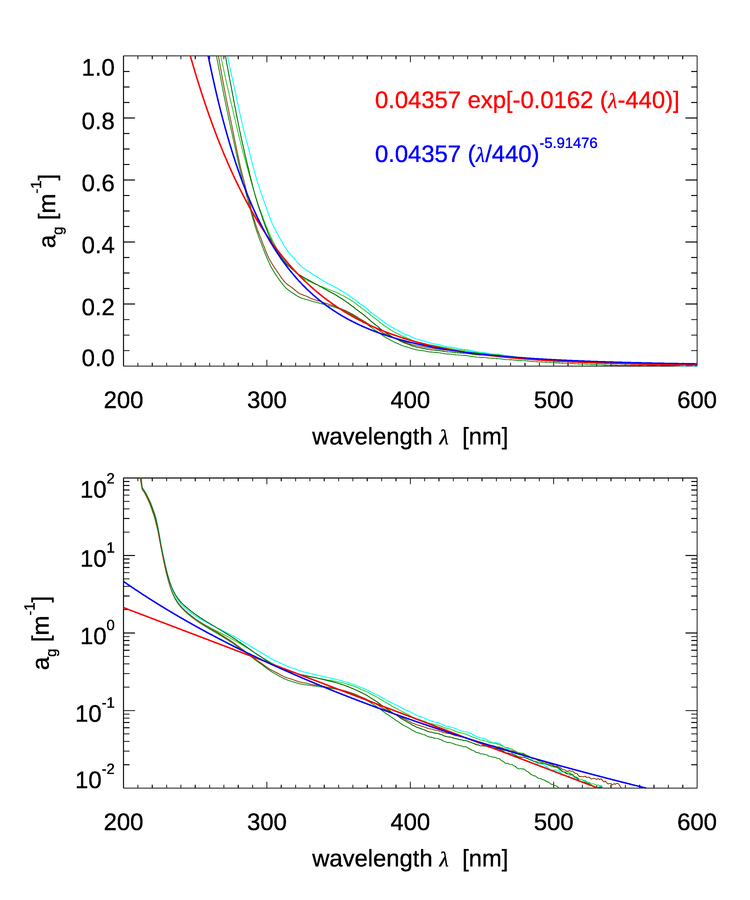
For wavelengths greater than 300 nm, which are the ones relevant to most optical oceanography, it is common to model CDOM absorption with an exponential function (e.g. Jerlov (1968)):
| (1) |
where is referred to as the spectral slope parameter and is a reference wavelength, which is often taken to be 440 nm. A theoretical explanation for this shape has been hypothesized by Shifrin (1988) as arising from a superposition of resonances of different molecular -bonds in the long organic molecules comprising CDOM. Single bonds, which are most abundant, will absorb short wavelength radiation while resonances of multiple bonds, less abundant, absorb longer wavelength radiation. Since numerically there many more short bonds, the absorption is higher at shorter wavelengths. This explanation is consistent with the observation that small values of the spectral slope of CDOM, , are associated with higher molecular weight materials (e.g. Carder et al. (1989), Yacobi et al. (2003)). For visible wavelengths the most common values of appear to be near , varying in the visible from 0.007 to (e.g. Table 1 in Twardowski et al. (2004).
While (1) is the most frequent model of CDOM absorption, other models have been suggested and may provide a better fit to data (even when taking into account that fits improve as more free parameters are available in the fit, e.g. Twardowski et al. (2004). In particular, often a constant is added to the exponential fit:
What this constant represents is not clear. In some cases it is supposed to account for scattering by the dissolved component, however there is no reason to believe such scattering would be spectrally flat (see Bricaud et al. (1981) for an in-depth discussion). It may account for bubbles in the sample.
Another model that has been found to work even better than the exponential model is a power-law model (e.g. Twardowski et al. (2004):
| (2) |
Given that molecular absorption is often a symmetric function for a given chromophore, frequency domain fit has been suggested (e.g. Schwarz et al. (2002)). Those are based on Gaussian or Lorentzian functions with the visible domain being the tail-end of the distribution. Trying to fit together UV and visible bands is complicated by the absorption of UV light by dissolved salts which are not part of DOC.
Elastic Scattering by CDOM
The CDOM contribution to scattering by seawater is somewhat controversial. By definition colloids are part of DOM and, if abundant enough, could contribute significantly to scattering (particularly to backscattering, see Stramski and Wozniak (2005)) by sea water. However, there is no observational evidence that CDOM contributes significantly to scattering (see Dall’Olmo et al. (2009) for recent measurements). Thus, currently, CDOM contribution to scattering is most often neglected.
Inelastic Scattering by CDOM
One of the primary methods to quantify CDOM is through fluorescence. Since not all dissolve material that absorbs fluoresces, this material is often denoted as FDOM. In general absorption and fluorescence covary, however their ratio can vary by orders of magnitude between different locations. The measurement of CDOM fluorescence in the field is often limited to a single excitation/emission band pair. With lab instrumentation two-dimensional excitation-emission spectra (EEMS) can be measured and used to characterize the FDOM based on the size and presence of known excitation-emission peaks (see, for example, table 1 in Coble (2007)). This is discussed in more detail on the CDOM Fluorescence page.
 See comments posted for this page and leave your own.